Develop reports with AI
Ask for a dashboard, a new report page or a change to a single chart. AI uses your data model to generate queries, visuals and filters. Preview and refine the validated draft before you publish it.
Canvas
Describe the report you need and let Canvas build a working first draft from your data. Deliver interactive dashboards and formal reports without a separate traditional BI licence for every reader.
Enquire about Canvas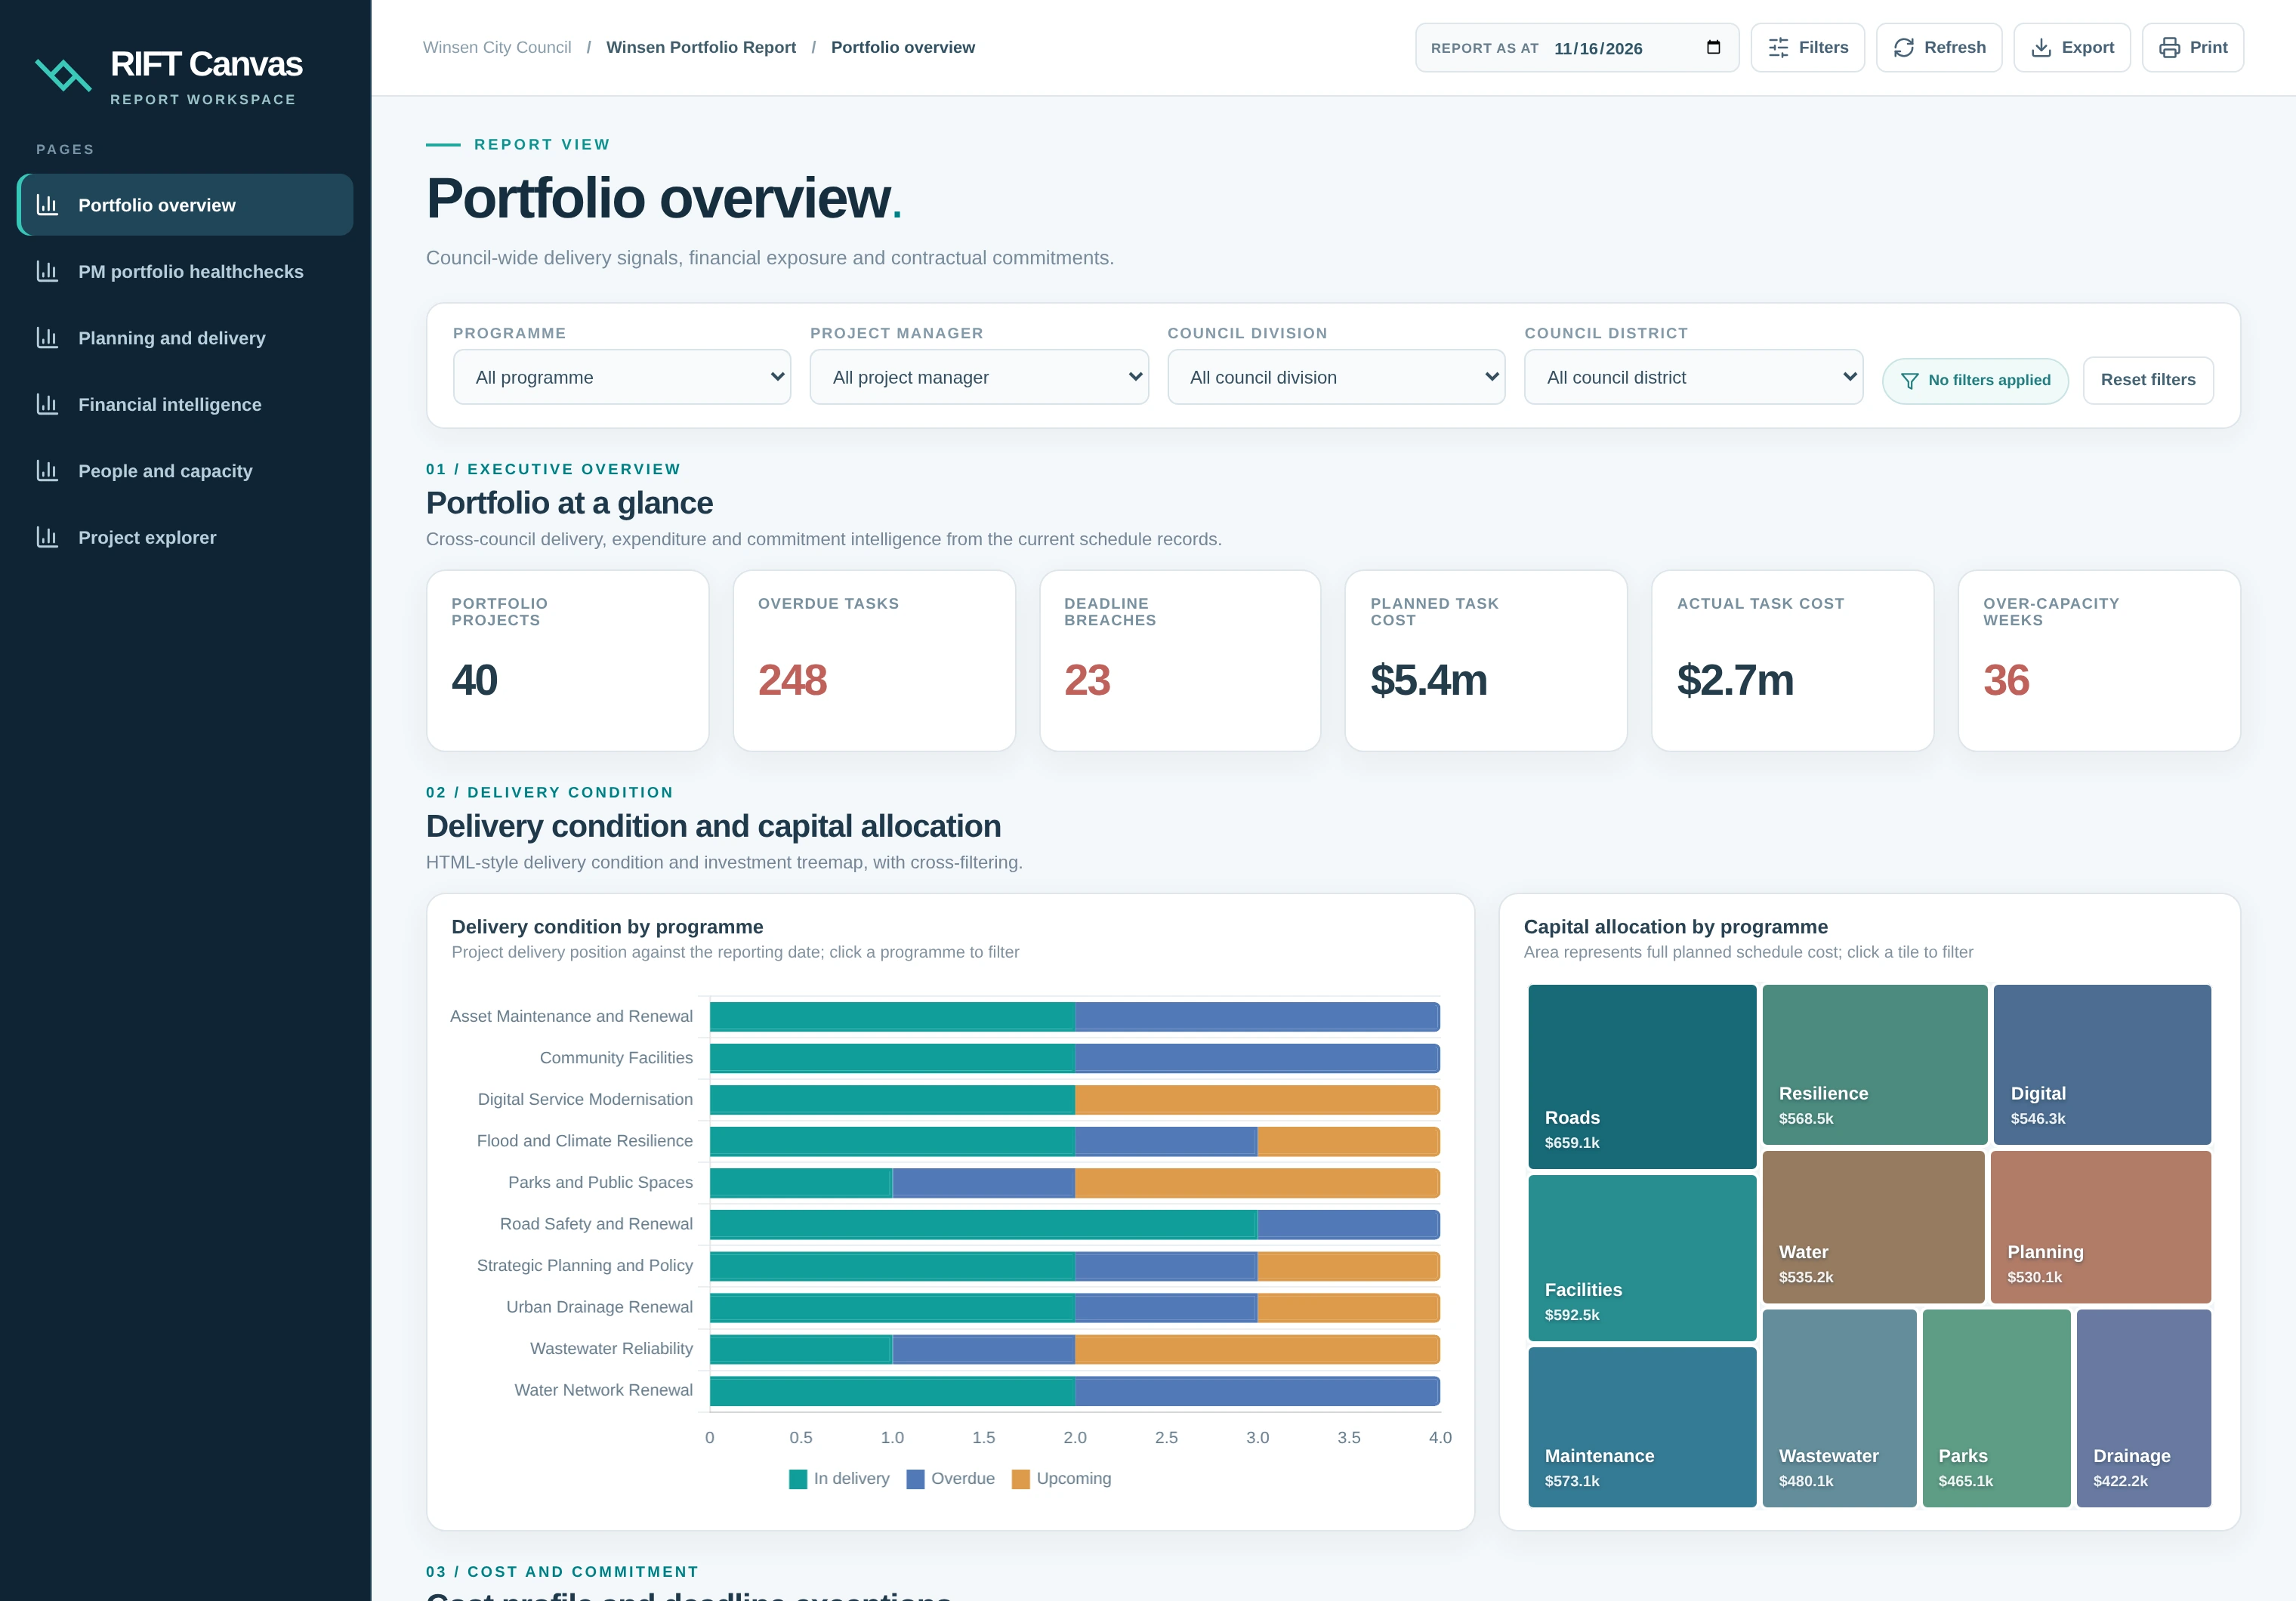
Ask for a dashboard, a new report page or a change to a single chart. AI uses your data model to generate queries, visuals and filters. Preview and refine the validated draft before you publish it.
Queries, layouts, filters and drill-through rules live in a portable report definition. Edit it visually or as code, reuse it as a template and track changes in source control.
Give readers filters, interactive charts and access to the records behind each figure. Deliver reports through the Canvas workspace or embed them in your own application.
Build portfolio reporting on Horizon schedules, milestones, baselines, costs and resource assignments. Move from a portfolio measure to the projects and tasks behind it. Canvas can also connect to your own PostgreSQL-backed data.
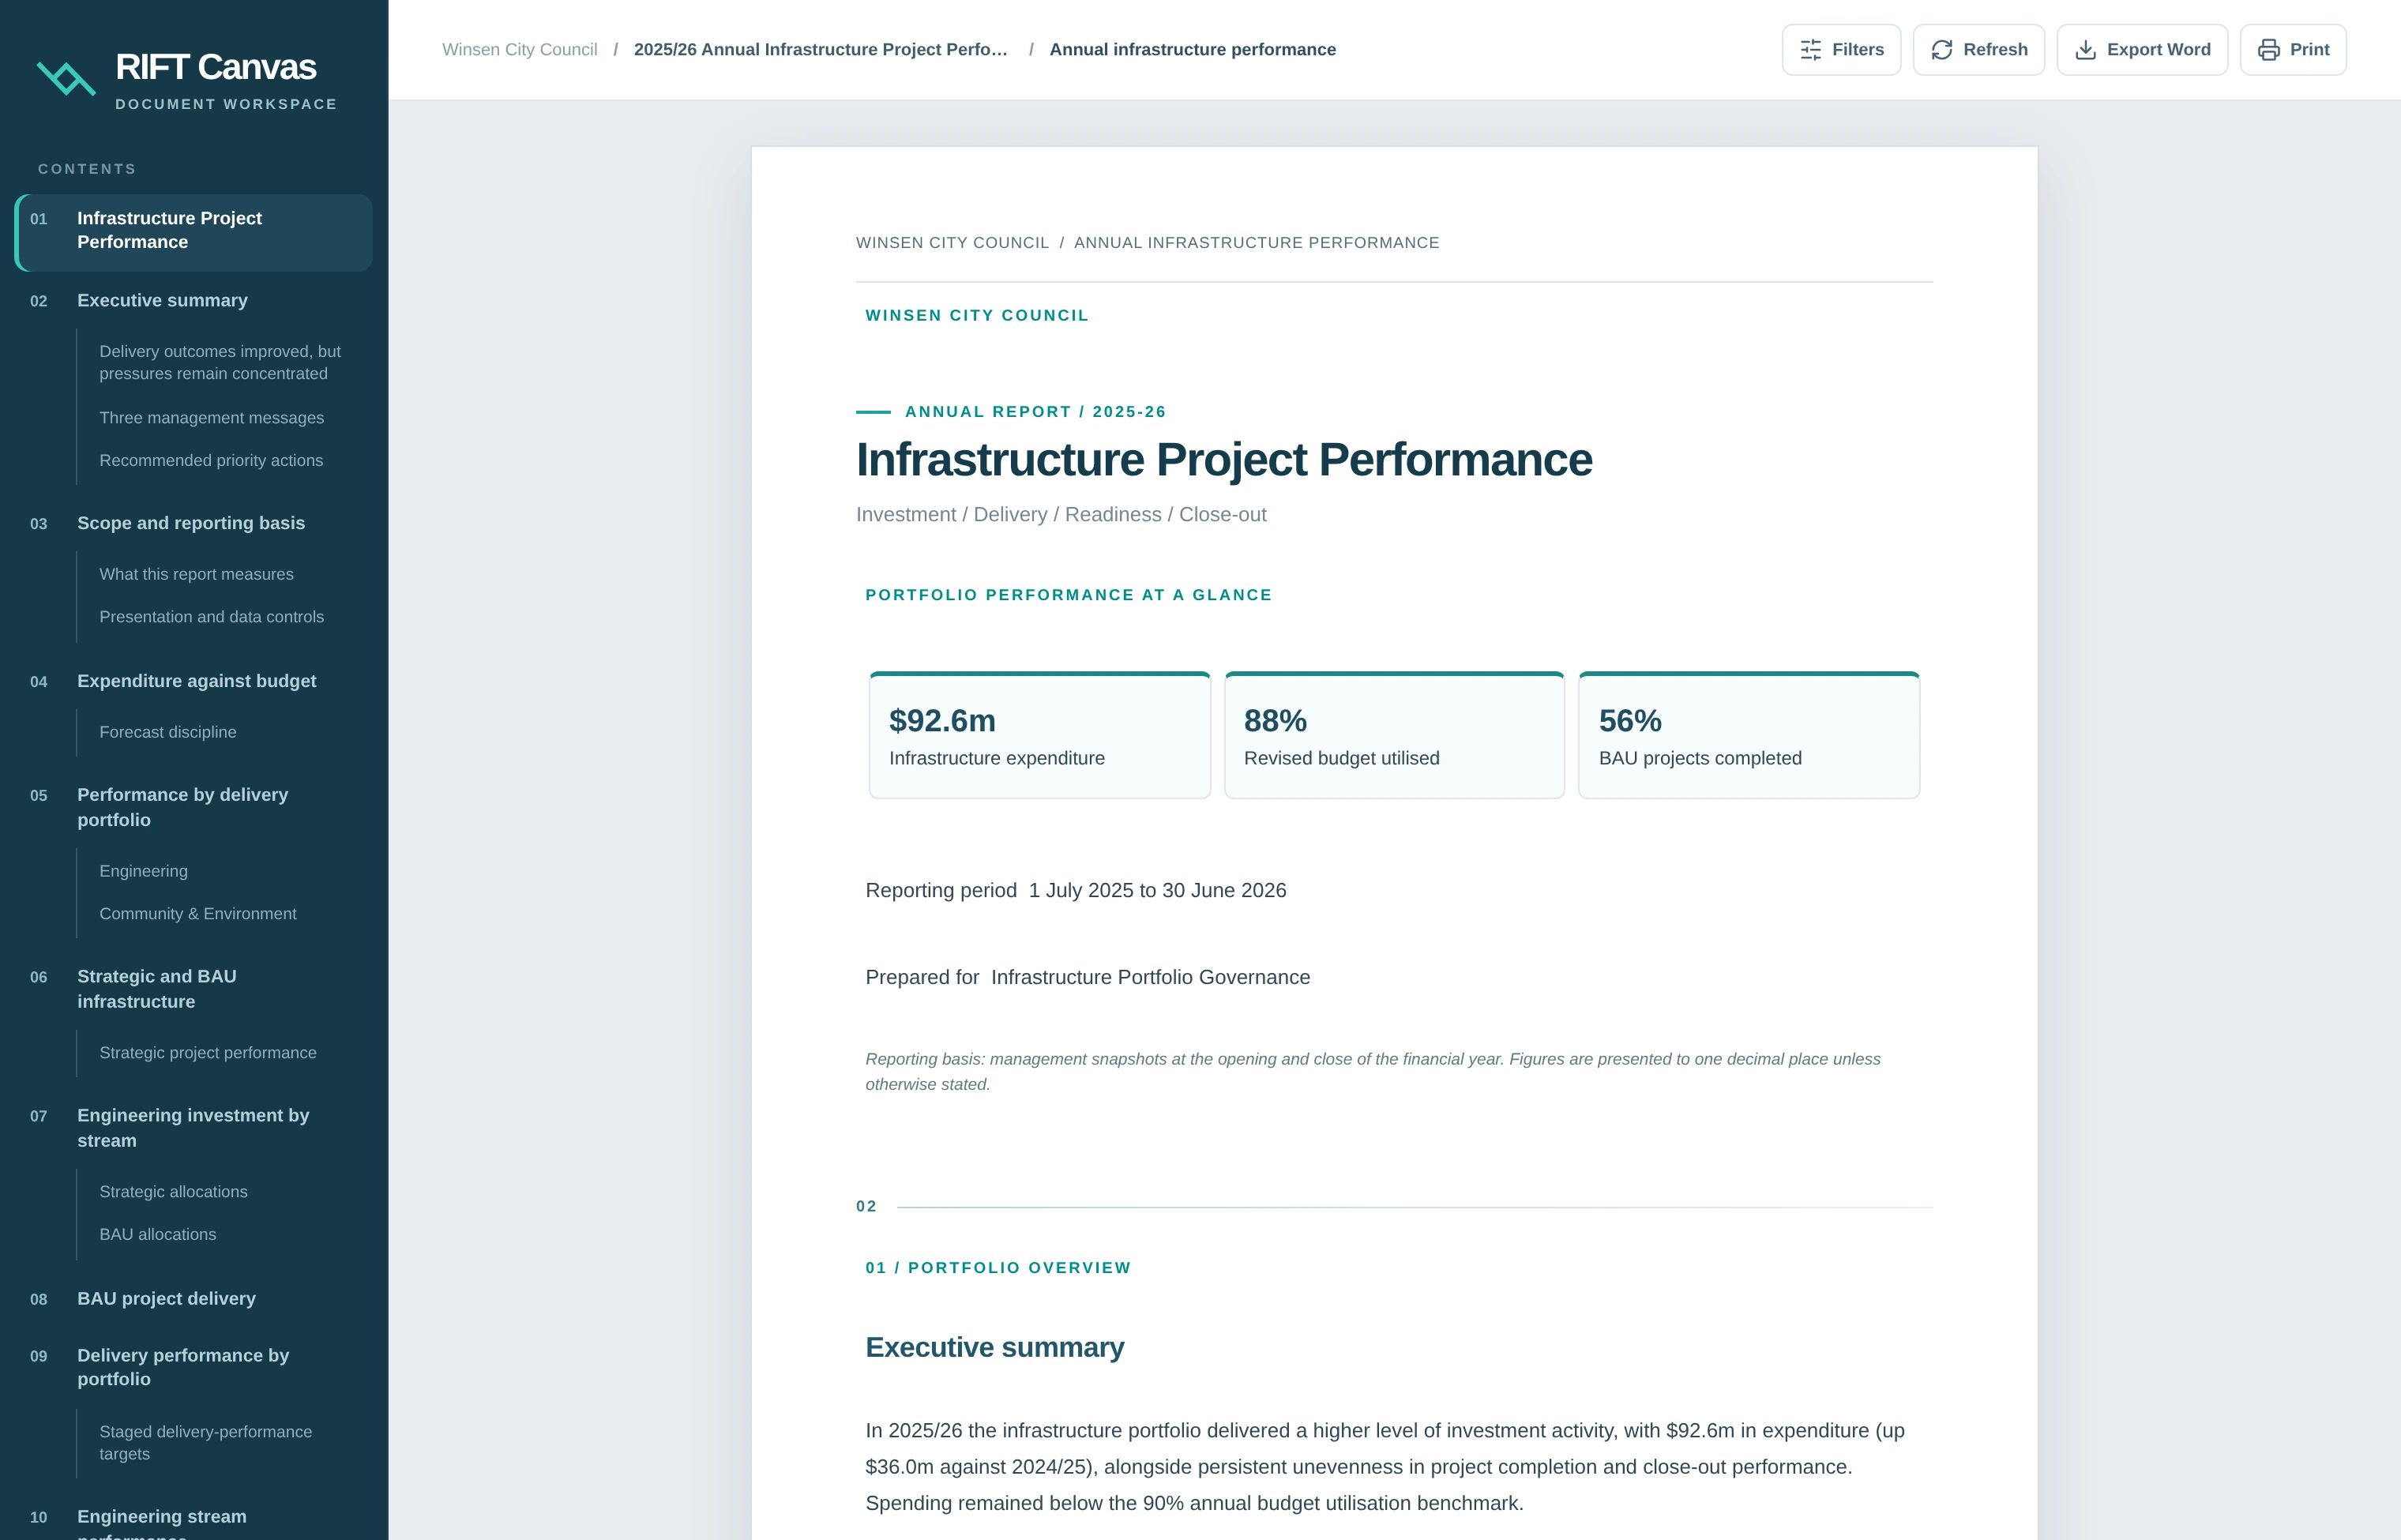
Use the same reporting workspace to create structured documents for boards, clients and delivery teams. Combine narrative, charts and data-driven tables, then print or export to Word.
Tell us what you need to report on and how your teams will use it.