AI-assisted report development
- Prompt to working draft
- Describe the dashboard or report you need and use AI to build queries, pages, filters and visuals against the connected data model.
- Targeted changes
- Ask AI to refine a single chart or revise the report as a whole, using the existing report definition as context.
- Review before publishing
- Preview the validated draft, check the figures and refine the layout before approving changes.
Report configuration as code
- Portable report definitions
- Keep queries, layouts, filters and drill-through rules in a reusable definition that can be tracked in source control.
- Visual editing
- Arrange and resize components, edit text in place and configure how data is presented.
- Templates and extensions
- Duplicate a report as a starting point for another audience or add custom visuals for specialised reporting.
Horizon and SQL data
- Direct Horizon reporting
- Use schedules, milestones, baselines, costs and resource assignments to report on delivery and capacity across projects.
- PostgreSQL datasets
- Build parameterised queries against connected data, preview the results and reuse datasets across report components.
- Data bindings
- Connect fields to chart values, table columns and filters so readers can explore the same metrics from different angles.
Interactive dashboards
- Multi-page reports
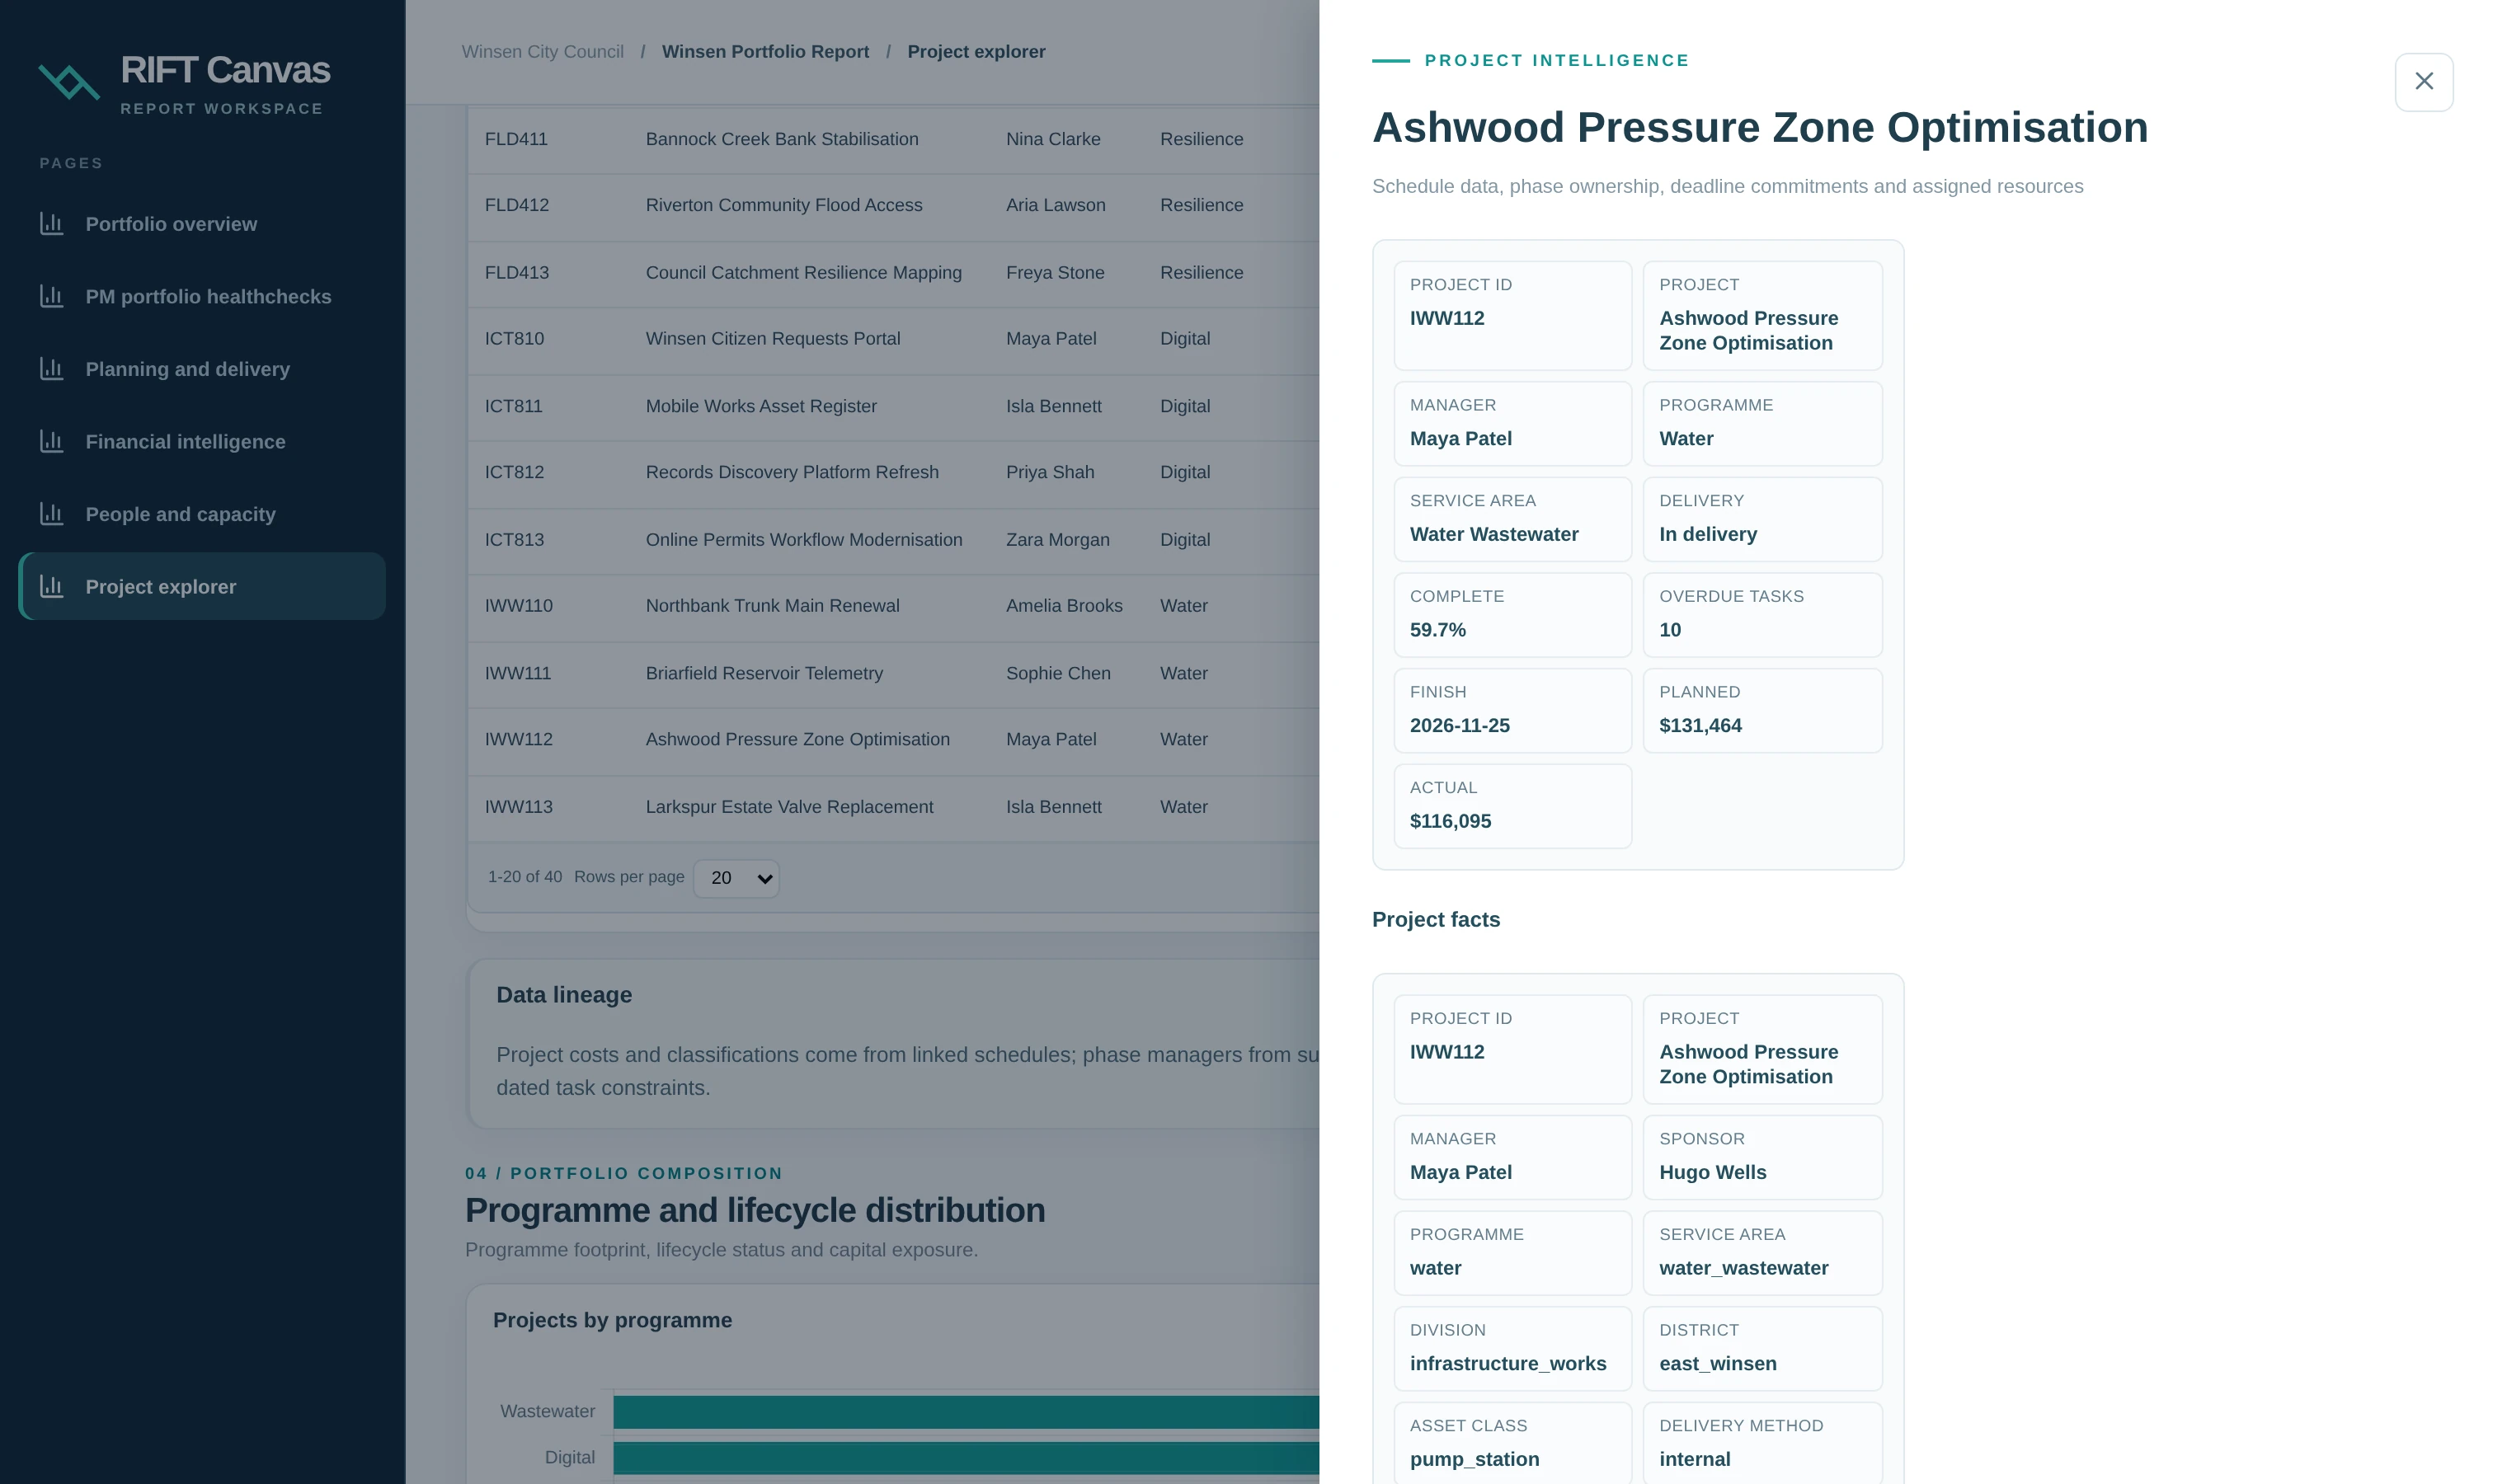
- Combine KPIs, charts, timelines and searchable registers into focused views for different teams.
- Filters and cross-filtering
- Use report filters to narrow the view, or select a chart segment to focus related visuals.
- Record drill-through
- Move from a summary or register row to the underlying project, task or other records defined for the report.
Structured documents and exports
- Formal documents
- Combine narrative, charts and data-driven tables with a table of contents for board, client and operational reporting.
- Word and print
- Export a structured document to Word for review and circulation, or print it from the report workspace.
- Data and graphics
- Export report data to CSV and download graphics from individual visuals.